I-485 — Green Card (AOS) Processing Times
Application to Register Permanent Residence or Adjust Status
14.6 mo – 30.6 mo
avg. across all field offices
Current I-485 Processing Time
As of , USCIS I-485 (Application to Register Permanent Residence or Adjust Status) processing times average 14.6 mo to 30.6 mo across all field offices, with full range 5.0 mo to 57.5 mo. The fastest processing is at Burlington, VT (5.0 mo). Processing times have been increasing over the past three months. Data is checked daily from official USCIS estimates.
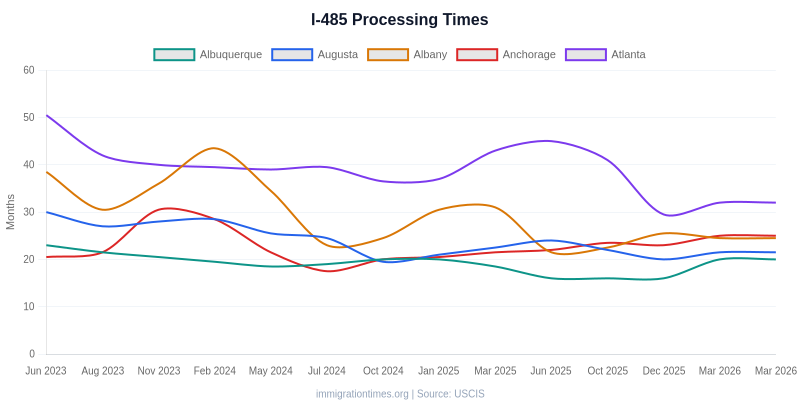
Processing Time Trend
Upper bound of processing time range shown. Source: USCIS Processing Times.
<iframe src="https://immigrationtimes.org/embed/i-485.html" width="600" height="400" frameborder="0" title="I-485 Processing Times"></iframe>
<p>Source: <a href="https://immigrationtimes.org/forms/i-485/">I-485 Processing Times — ImmigrationTimes.org</a></p>
I-485 Processing Times by Field Office
92| Field Office | Min | Max | Status |
|---|---|---|---|
| Burlington, VT (STA) Fastest | 5.0 mo | 10.5 mo | Fast |
| Buffalo, NY (BUF) | 6.5 mo | 13.0 mo | Fast |
| Tucson, AZ (TUC) | 8.0 mo | 14.5 mo | Fast |
| Manchester, NH (MAN) | 8.0 mo | 15.5 mo | Fast |
| Fort Smith, AR (FSA) | 12.0 mo | 16.0 mo | Fast |
| Kansas City, MO (KAN) | 10.5 mo | 16.0 mo | Fast |
| Greer, SC (GRR) | 11.0 mo | 17.0 mo | Fast |
| Montgomery, AL (MGA) | 11.0 mo | 17.0 mo | Fast |
| Saint Louis, MO (STL) | 10.0 mo | 17.5 mo | Fast |
| Charleston, SC (CHL) | 13.0 mo | 18.0 mo | Fast |
| Nashville, TN (NTN) | 11.5 mo | 18.5 mo | Fast |
| Wichita, KS (WIC) | 9.5 mo | 18.5 mo | Fast |
| Honolulu, HI (HHW) | 10.5 mo | 19.5 mo | Fast |
| Pittsburgh, PA (PIT) | 8.5 mo | 20.0 mo | Fast |
| Salt Lake City, UT (SLC) | 10.0 mo | 20.0 mo | Fast |
| Tampa, FL (TAM) | 14.0 mo | 20.0 mo | Fast |
| Des Moines, IA (DSM) | 12.5 mo | 20.5 mo | Fast |
| Omaha, NE (OMA) | 9.5 mo | 20.5 mo | Fast |
| Boise, ID (BOI) | 10.5 mo | 21.0 mo | Normal |
| Boston, MA (BOS) | 10.5 mo | 21.5 mo | Normal |
| Harlingen, TX (HLG) | 10.0 mo | 21.5 mo | Normal |
| Philadelphia, PA (PHI) | 12.0 mo | 21.5 mo | Normal |
| El Paso, TX (ELP) | 11.0 mo | 22.0 mo | Normal |
| Phoenix, AZ (PHO) | 12.0 mo | 22.0 mo | Normal |
| San Antonio, TX (SNA) | 12.5 mo | 22.0 mo | Normal |
| Cincinnati, OH (CIN) | 10.5 mo | 22.5 mo | Normal |
| Kendall, FL (KND) | 13.5 mo | 23.5 mo | Normal |
| San Diego, CA (SND) | 9.5 mo | 23.5 mo | Normal |
| Albany, NY (ALB) | 14.5 mo | 24.0 mo | Normal |
| Dallas, TX (DAL) | 11.5 mo | 24.0 mo | Normal |
| Helena, MT (HEL) | 7.5 mo | 24.0 mo | Normal |
| Louisville, KY (LOU) | 12.5 mo | 24.5 mo | Normal |
| West Palm Beach, FL (WPB) | 12.0 mo | 24.5 mo | Normal |
| Washington, DC (WAS) | 16.0 mo | 25.0 mo | Normal |
| Portland, OR (POO) | 10.5 mo | 25.5 mo | Normal |
| Hartford, CT (HAR) | 12.0 mo | 26.0 mo | Normal |
| Reno, NV (REN) | 12.5 mo | 26.0 mo | Normal |
| Cleveland, OH (CLE) | 15.0 mo | 26.5 mo | Normal |
| Fort Myers, FL (OFM) | 17.0 mo | 26.5 mo | Normal |
| Yakima, WA (YAK) | 14.5 mo | 26.5 mo | Normal |
| Indianapolis, IN (INP) | 13.0 mo | 27.0 mo | Normal |
| Providence, RI (PRO) | 12.5 mo | 27.0 mo | Normal |
| Anchorage, AK (ANC) | 10.5 mo | 27.5 mo | Normal |
| Memphis, TN (MEM) | 15.0 mo | 27.5 mo | Normal |
| Atlanta, GA (ATL) | 14.5 mo | 28.0 mo | Normal |
| Detroit, MI (DET) | 12.0 mo | 28.0 mo | Normal |
| Milwaukee, WI (MIL) | 14.0 mo | 28.5 mo | Normal |
| San Bernardino, CA (SBD) | 16.0 mo | 28.5 mo | Normal |
| Albuquerque, NM (ABQ) | 13.0 mo | 29.0 mo | Normal |
| Christiansted, VI (CHR) | 28.5 mo | 29.0 mo | Normal |
| Charlotte, NC (CLT) | 16.5 mo | 29.0 mo | Normal |
| Fresno, CA (FRE) | 13.0 mo | 29.0 mo | Normal |
| Jacksonville, FL (JAC) | 13.5 mo | 29.0 mo | Normal |
| Lawrence, MA (LAW) | 15.0 mo | 29.0 mo | Normal |
| Agana, GU (AGA) | 12.5 mo | 30.0 mo | Normal |
| Houston, TX (HOU) | 16.0 mo | 30.0 mo | Normal |
| San Fernando Valley, CA (SFV) | 11.0 mo | 30.0 mo | Normal |
| Charlotte Amalie, VI (CHA) | 11.5 mo | 30.5 mo | Normal |
| Las Vegas, NV (LVG) | 14.5 mo | 30.5 mo | Normal |
| Portland, ME (POM) | 14.5 mo | 30.5 mo | Normal |
| Hialeah, FL (HIA) | 15.0 mo | 31.5 mo | Normal |
| Cranbury, NJ (NJC) | 16.0 mo | 32.0 mo | Normal |
| Orlando, FL (ORL) | 13.5 mo | 32.0 mo | Normal |
| New York City, NY (NYC) | 14.0 mo | 32.5 mo | Normal |
| Minneapolis-St. Paul, MN (SPM) | 14.5 mo | 32.5 mo | Normal |
| Columbus, OH (CLM) | 11.0 mo | 33.0 mo | Slow |
| New Orleans, LA (NOL) | 17.0 mo | 33.0 mo | Slow |
| Oklahoma City, OK (OKC) | 14.0 mo | 33.5 mo | Slow |
| Sacramento, CA (SAC) | 14.0 mo | 33.5 mo | Slow |
| Chicago, IL (CHI) | 12.5 mo | 34.0 mo | Slow |
| Los Angeles County, CA (LAC) | 16.0 mo | 34.0 mo | Slow |
| Mount Laurel, NJ (MTL) | 19.0 mo | 34.0 mo | Slow |
| Raleigh, NC (RAL) | 19.0 mo | 34.5 mo | Slow |
| Denver, CO (DEN) | 16.0 mo | 35.5 mo | Slow |
| Long Island, NY (LNY) | 16.5 mo | 35.5 mo | Slow |
| Newark, NJ (NEW) | 19.0 mo | 35.5 mo | Slow |
| Los Angeles, CA (LOS) | 16.5 mo | 36.0 mo | Slow |
| Queens, NY (QNS) | 15.5 mo | 36.5 mo | Slow |
| San Jose, CA (SNJ) | 17.0 mo | 37.5 mo | Slow |
| Imperial, CA (IMP) | 15.0 mo | 39.0 mo | Slow |
| Miami, FL (MIA) | 20.5 mo | 39.5 mo | Slow |
| Oakland Park, FL (OKL) | 23.5 mo | 39.5 mo | Slow |
| San Francisco, CA (SFR) | 15.5 mo | 39.5 mo | Slow |
| Service Center Operations (SCD) | 34.7 mo | 39.8 mo | Slow |
| Norfolk, VA (NOR) | 22.0 mo | 40.0 mo | Slow |
| Brooklyn, NY (BNY) | 17.5 mo | 41.0 mo | Slow |
| Santa Ana, CA (SAA) | 17.0 mo | 41.0 mo | Slow |
| San Juan, PR (SAJ) | 16.5 mo | 42.5 mo | Very Slow |
| Baltimore, MD (BAL) | 21.0 mo | 43.0 mo | Very Slow |
| Field Office Directorate (FOD) | 23.3 mo | 48.3 mo | Very Slow |
| Seattle, WA (SEA) | 17.0 mo | 52.0 mo | Very Slow |
| Spokane, WA (SPO) | 15.0 mo | 57.5 mo | Very Slow |
Cite This Data
Citation
As of Jun 23, 2026, USCIS processing times for I-485 (Application to Register Permanent Residence or Adjust Status) range from 5.0 mo to 57.5 mo across all field offices (full range; average 14.6 mo–30.6 mo across offices). Source: ImmigrationTimes.org/forms/i-485/. Dataset DOI: 10.5281/zenodo.19529862
Download PNG
Chart image with watermark
Download JSON
Raw data via API
Download CSV
Spreadsheet-ready data
<iframe src="https://immigrationtimes.org/embed/i-485.html" width="600" height="400" frameborder="0" title="I-485 Processing Times"></iframe>
<p>Source: <a href="https://immigrationtimes.org/forms/i-485/">I-485 Processing Times — ImmigrationTimes.org</a></p>
Frequently Asked Questions
Current USCIS I-485 processing times range from 5.0 mo to 57.5 mo across all field offices (full range; average 14.6 mo–30.6 mo across offices). This data is updated daily from USCIS official processing time estimates.
Based on current data, Burlington, VT has the shortest I-485 processing times at 5.0 mo. See the full comparison in the table above.
Based on data from the last three months, I-485 processing times are increasing. Processing times have risen compared to three months ago. View the trend chart above for the full historical picture.
You can check official processing times on the USCIS website at egov.uscis.gov/processing-times. Select your form (I-485), the field office that is processing your case, and your filing category. ImmigrationTimes.org tracks these same times with historical trends and comparisons.
Processing times for I-485 vary by field office, filing category, case complexity, and current USCIS workload. Security checks, requests for evidence (RFEs), and application volume can all affect how long a case takes. The field office comparison table above shows how times differ by location.
Green Card (AOS) petitions are filed using USCIS Form I-485. Current processing times range from 5.0 mo to 57.5 mo across all field offices (full range; average 14.6 mo–30.6 mo across offices). This data is updated daily from official USCIS processing time estimates.
Get Alerts
Receive an email when I-485 processing times change.
Source: U.S. Citizenship and Immigration Services (USCIS). Data aggregated from daily USCIS processing time snapshots. Each office's range averages only the filing categories for which USCIS publishes both a lower and an upper bound, so both endpoints cover the same categories. Data last updated . Permanent link. Verify on USCIS.gov.
Related Forms
I-130
Family Green Card Petition
Petition for Alien Relative
105.1 mo – 143.6 mo
I-140
EB-1 / EB-2 / EB-3
Immigrant Petition for Alien Workers
16.6 mo – 19.8 mo
I-765
EAD
Application for Employment Authorization
10.6 mo – 14.7 mo
I-131
Application for Travel Documents, Parole Documents, and Arrival/Departure Records
19.3 mo – 22.5 mo
N-400
U.S. Citizenship
Application for Naturalization
9.8 mo – 12.6 mo
See all green card processing times — compare family-based, employment-based, and other pathways.