N-600 Processing Times
Application for Certificate of Citizenship
9.5 mo – 13.5 mo
avg. across all field offices
Current N-600 Processing Time
As of , USCIS N-600 (Application for Certificate of Citizenship) processing times average 9.5 mo to 13.5 mo across all field offices, with full range 3.0 mo to 52.5 mo. The shortest reported maximum is tied at 4.0 mo across Charlotte Amalie, VI and Cincinnati, OH. Processing times have been relatively stable over the past three months. Data is checked daily from official USCIS estimates.
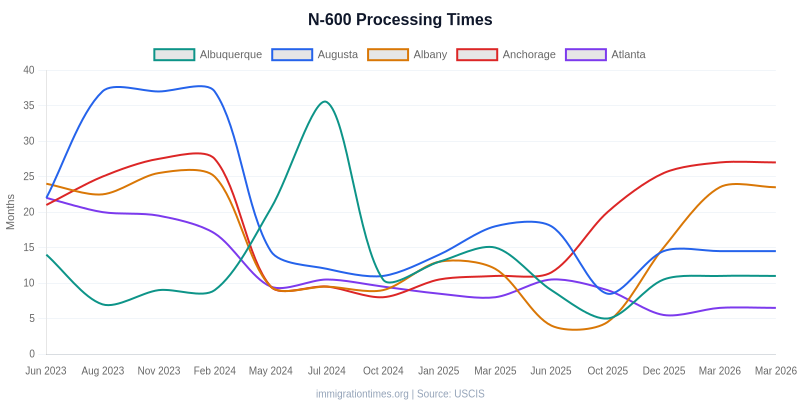
Processing Time Trend
Upper bound of processing time range shown. Source: USCIS Processing Times.
<iframe src="https://immigrationtimes.org/embed/n-600.html" width="600" height="400" frameborder="0" title="N-600 Processing Times"></iframe>
<p>Source: <a href="https://immigrationtimes.org/forms/n-600/">N-600 Processing Times — ImmigrationTimes.org</a></p>
N-600 Processing Times by Field Office
90| Field Office | Min | Max | Status |
|---|---|---|---|
| Charlotte Amalie, VI (CHA) Tied fastest | 3.0 mo | 4.0 mo | Fast |
| Cincinnati, OH (CIN) Tied fastest | 3.5 mo | 4.0 mo | Fast |
| Providence, RI (PRO) | 4.5 mo | 5.0 mo | Fast |
| Fort Smith, AR (FSA) | 4.0 mo | 5.5 mo | Fast |
| Manchester, NH (MAN) | 4.0 mo | 5.5 mo | Fast |
| Christiansted, VI (CHR) | 5.5 mo | 6.0 mo | Fast |
| Charleston, SC (CHL) | 6.0 mo | 6.5 mo | Fast |
| Portland, ME (POM) | 5.5 mo | 6.5 mo | Fast |
| Atlanta, GA (ATL) | 4.5 mo | 7.0 mo | Fast |
| Greer, SC (GRR) | 5.0 mo | 7.0 mo | Fast |
| Boise, ID (BOI) | 6.5 mo | 7.5 mo | Fast |
| Columbus, OH (CLM) | 3.5 mo | 7.5 mo | Fast |
| Cranbury, NJ (NJC) | 5.5 mo | 7.5 mo | Fast |
| Hialeah, FL (HIA) | 6.0 mo | 8.0 mo | Fast |
| Dallas, TX (DAL) | 7.5 mo | 8.5 mo | Fast |
| Indianapolis, IN (INP) | 6.0 mo | 8.5 mo | Fast |
| Portland, OR (POO) | 6.0 mo | 8.5 mo | Fast |
| Baltimore, MD (BAL) | 7.0 mo | 9.0 mo | Fast |
| Honolulu, HI (HHW) | 7.0 mo | 9.0 mo | Fast |
| Newark, NJ (NEW) | 7.0 mo | 9.0 mo | Fast |
| Queens, NY (QNS) | 7.5 mo | 9.0 mo | Fast |
| San Jose, CA (SNJ) | 7.0 mo | 9.0 mo | Fast |
| Burlington, VT (STA) | 8.5 mo | 9.0 mo | Fast |
| Hartford, CT (HAR) | 6.5 mo | 9.5 mo | Normal |
| Kendall, FL (KND) | 7.0 mo | 9.5 mo | Normal |
| Los Angeles, CA (LOS) | 6.5 mo | 9.5 mo | Normal |
| Norfolk, VA (NOR) | 8.0 mo | 9.5 mo | Normal |
| Sacramento, CA (SAC) | 8.0 mo | 9.5 mo | Normal |
| San Fernando Valley, CA (SFV) | 5.0 mo | 9.5 mo | Normal |
| Yakima, WA (YAK) | 8.0 mo | 9.5 mo | Normal |
| Brooklyn, NY (BNY) | 7.0 mo | 10.0 mo | Normal |
| Louisville, KY (LOU) | 7.0 mo | 10.0 mo | Normal |
| Las Vegas, NV (LVG) | 9.5 mo | 10.0 mo | Normal |
| New York City, NY (NYC) | 7.5 mo | 10.0 mo | Normal |
| Los Angeles County, CA (LAC) | 8.5 mo | 10.5 mo | Normal |
| Long Island, NY (LNY) | 9.5 mo | 10.5 mo | Normal |
| Mount Laurel, NJ (MTL) | 8.0 mo | 10.5 mo | Normal |
| Philadelphia, PA (PHI) | 7.5 mo | 10.5 mo | Normal |
| Tampa, FL (TAM) | 9.0 mo | 10.5 mo | Normal |
| Tucson, AZ (TUC) | 8.5 mo | 10.5 mo | Normal |
| Fresno, CA (FRE) | 10.0 mo | 11.0 mo | Normal |
| Lawrence, MA (LAW) | 7.5 mo | 11.0 mo | Normal |
| New Orleans, LA (NOL) | 8.0 mo | 11.0 mo | Normal |
| Fort Myers, FL (OFM) | 10.5 mo | 11.0 mo | Normal |
| Oklahoma City, OK (OKC) | 8.5 mo | 11.0 mo | Normal |
| San Antonio, TX (SNA) | 9.5 mo | 11.0 mo | Normal |
| Washington, DC (WAS) | 8.5 mo | 11.0 mo | Normal |
| Albuquerque, NM (ABQ) | 11.0 mo | 11.5 mo | Normal |
| Charlotte, NC (CLT) | 9.0 mo | 11.5 mo | Normal |
| Nashville, TN (NTN) | 10.5 mo | 11.5 mo | Normal |
| Omaha, NE (OMA) | 7.0 mo | 11.5 mo | Normal |
| Phoenix, AZ (PHO) | 10.0 mo | 11.5 mo | Normal |
| Santa Ana, CA (SAA) | 10.0 mo | 11.5 mo | Normal |
| San Juan, PR (SAJ) | 9.0 mo | 11.5 mo | Normal |
| Wichita, KS (WIC) | 10.5 mo | 11.5 mo | Normal |
| Detroit, MI (DET) | 7.0 mo | 12.0 mo | Normal |
| Montgomery, AL (MGA) | 9.5 mo | 12.0 mo | Normal |
| Pittsburgh, PA (PIT) | 9.5 mo | 12.0 mo | Normal |
| Buffalo, NY (BUF) | 9.5 mo | 12.5 mo | Normal |
| Denver, CO (DEN) | 10.5 mo | 12.5 mo | Normal |
| Houston, TX (HOU) | 10.0 mo | 12.5 mo | Normal |
| San Bernardino, CA (SBD) | 10.5 mo | 12.5 mo | Normal |
| West Palm Beach, FL (WPB) | 10.0 mo | 12.5 mo | Normal |
| Orlando, FL (ORL) | 11.5 mo | 13.5 mo | Normal |
| Oakland Park, FL (OKL) | 7.5 mo | 14.5 mo | Normal |
| Salt Lake City, UT (SLC) | 11.5 mo | 14.5 mo | Normal |
| Spokane, WA (SPO) | 10.0 mo | 14.5 mo | Normal |
| Chicago, IL (CHI) | 12.5 mo | 15.0 mo | Normal |
| Helena, MT (HEL) | 12.0 mo | 15.5 mo | Normal |
| Milwaukee, WI (MIL) | 10.0 mo | 15.5 mo | Normal |
| San Francisco, CA (SFR) | 10.0 mo | 15.5 mo | Normal |
| Des Moines, IA (DSM) | 11.5 mo | 16.0 mo | Normal |
| Raleigh, NC (RAL) | 9.0 mo | 16.5 mo | Normal |
| Kansas City, MO (KAN) | 10.0 mo | 17.0 mo | Normal |
| Reno, NV (REN) | 17.0 mo | 17.5 mo | Normal |
| Jacksonville, FL (JAC) | 13.0 mo | 18.0 mo | Normal |
| Cleveland, OH (CLE) | 8.0 mo | 18.5 mo | Normal |
| Anchorage, AK (ANC) | 13.0 mo | 19.0 mo | Normal |
| Agana, GU (AGA) | 11.5 mo | 20.0 mo | Normal |
| Harlingen, TX (HLG) | 11.0 mo | 20.0 mo | Normal |
| Saint Louis, MO (STL) | 10.5 mo | 21.5 mo | Slow |
| Imperial, CA (IMP) | 14.5 mo | 23.5 mo | Slow |
| Seattle, WA (SEA) | 14.0 mo | 24.5 mo | Slow |
| Miami, FL (MIA) | 11.0 mo | 25.0 mo | Slow |
| San Diego, CA (SND) | 22.0 mo | 26.5 mo | Very Slow |
| Albany, NY (ALB) | 20.0 mo | 27.5 mo | Very Slow |
| Minneapolis-St. Paul, MN (SPM) | 22.0 mo | 30.0 mo | Very Slow |
| Boston, MA (BOS) | 14.0 mo | 45.5 mo | Very Slow |
| El Paso, TX (ELP) | 25.5 mo | 52.5 mo | Very Slow |
| Memphis, TN (MEM) | 33.5 mo | 52.5 mo | Very Slow |
Cite This Data
Citation
As of Jun 23, 2026, USCIS processing times for N-600 (Application for Certificate of Citizenship) range from 3.0 mo to 52.5 mo across all field offices (full range; average 9.5 mo–13.5 mo across offices). Source: ImmigrationTimes.org/forms/n-600/. Dataset DOI: 10.5281/zenodo.19529862
Download PNG
Chart image with watermark
Download JSON
Raw data via API
Download CSV
Spreadsheet-ready data
<iframe src="https://immigrationtimes.org/embed/n-600.html" width="600" height="400" frameborder="0" title="N-600 Processing Times"></iframe>
<p>Source: <a href="https://immigrationtimes.org/forms/n-600/">N-600 Processing Times — ImmigrationTimes.org</a></p>
Frequently Asked Questions
Current USCIS N-600 processing times range from 3.0 mo to 52.5 mo across all field offices (full range; average 9.5 mo–13.5 mo across offices). This data is updated daily from USCIS official processing time estimates.
Based on current data, the shortest reported maximum is tied at 4.0 mo across Charlotte Amalie, VI and Cincinnati, OH. See the full comparison in the table above.
Get Alerts
Receive an email when N-600 processing times change.
Source: U.S. Citizenship and Immigration Services (USCIS). Data aggregated from daily USCIS processing time snapshots. Each office's range averages only the filing categories for which USCIS publishes both a lower and an upper bound, so both endpoints cover the same categories. Data last updated . Permanent link.
Related Forms
N-400
U.S. Citizenship
Application for Naturalization
9.8 mo – 12.6 mo
N-565
Application for Replacement Naturalization/Citizenship Document
8.0 mo – 9.5 mo
N-600K
Application for Citizenship and Issuance of Certificate Under Section 322
16.4 mo – 24.0 mo
I-90
Application to Replace Permanent Resident Card
8.5 mo – 10.0 mo